
How to debug Salesforce APEX Code step by step with a breakpoint in VS Code?
With modern languages and IDE like IntelliJ, VS Code, Eclipse, it’s possible to debug code by putting a breakpoint, launch the server/application and debug on a step by step fashion.
Well, that’s possible when the running environment is located on your machine. But as you know, on Salesforce the runtime environment is in the cloud.
Fortunately, Salesforce provide a way to debug your Apex code, lets see it!!!
Apex Code to debug
Imagine you’re calling the following code from an Apex Trigger on the Opportunity Trigger.
public with sharing class ClassWithABug {
    public static void methodToDebug(List<Opportunity> opporunityList){
        for(Opportunity loopOpportunity : opporunityList){
            Boolean throwException = false;
            throwException = loopOpportunity.Name.startsWith('A');
            throwException = throwException && loopOpportunity.Amount > 500;
            if(throwException){
                throw new ToDebugException('You will never fix me :-)');
            }
        }
    }
    public class ToDebugException extends Exception{
    }
}
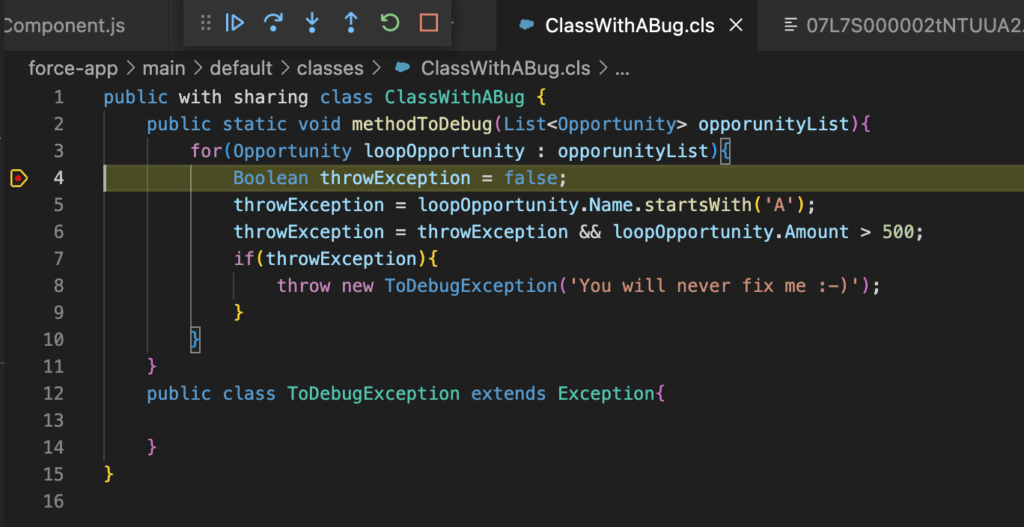
This code throws an Exception when the Name of the Opportunity starts with an A and the amount is more than 500.
Before to go further, it’s important to understand that it’s not live debugging. What will happen is that you will:
- Put a breakpoint
- Go to Salesforce and do what you have to do so that your code is triggered
- Get the logs locally
- Replay what have happened with the code, based on what is written in the log you retrieved
It’s important to understand that unlike Java, you’ll have less possibilities like changing a variable content for example.
But let’s deep dive into it!!
Push your breakpoint / checkpoint on Salesforce
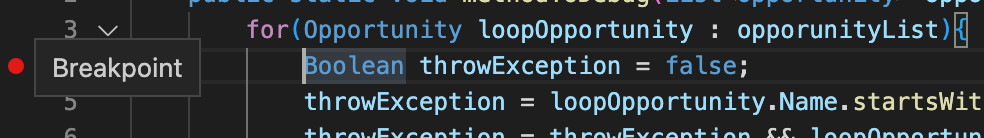
Click on the left of the line numbers on the line you want to start your debug on. For my Example, I put the breakpoint on the 4th line:
Now that the breakpoint / checkpoint is added, it’s time to add it to your org.
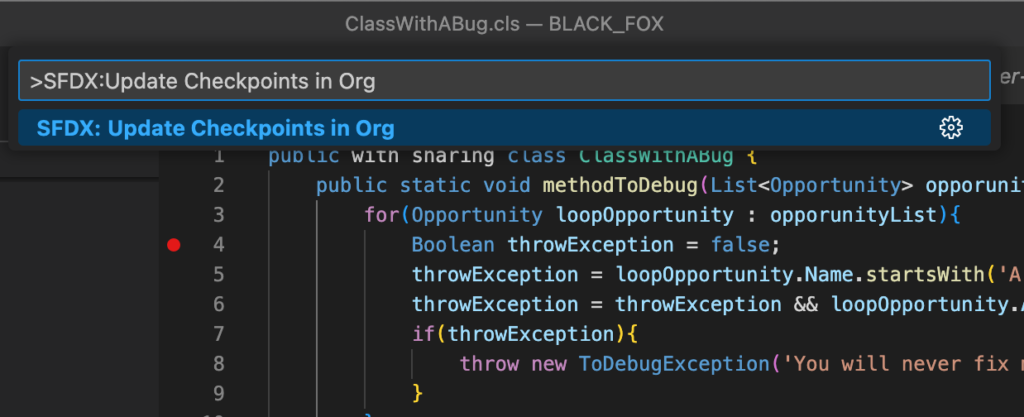
Press CTRL + SHIFT + P and type: SFDX:Update Checkpoints in Org and select it.
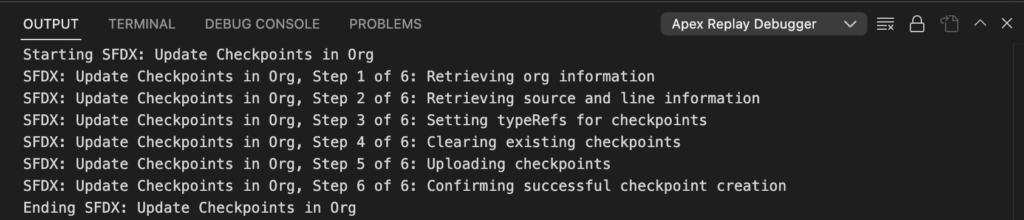
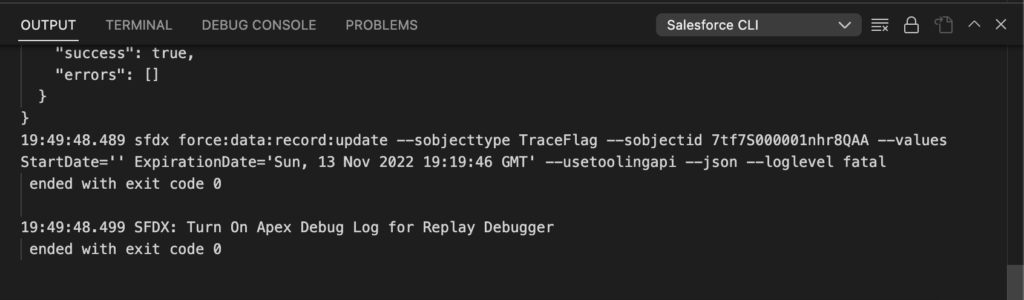
Wait for the confirmation in the terminal that the breakpoint / checkpoint have been added:
Activate Apex Debug mode on the Salesforce ORG
It’s now time to Activate the Debug mode on your Salesforce org! Please note that this session will be available only for 30 minutes!!
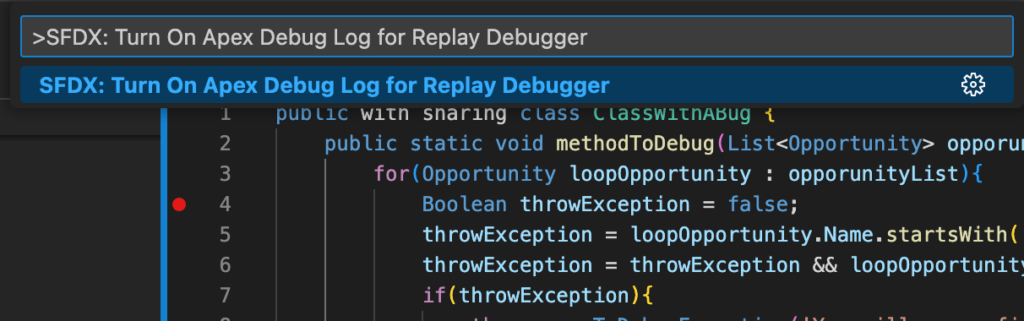
Press CTRL + SHIFT + P in VS Code and type: SFDX: Turn On Apex Debug Log for Replay Debugger and press Enter
Wait for the confirmation
Run the code on the Salesforce org.
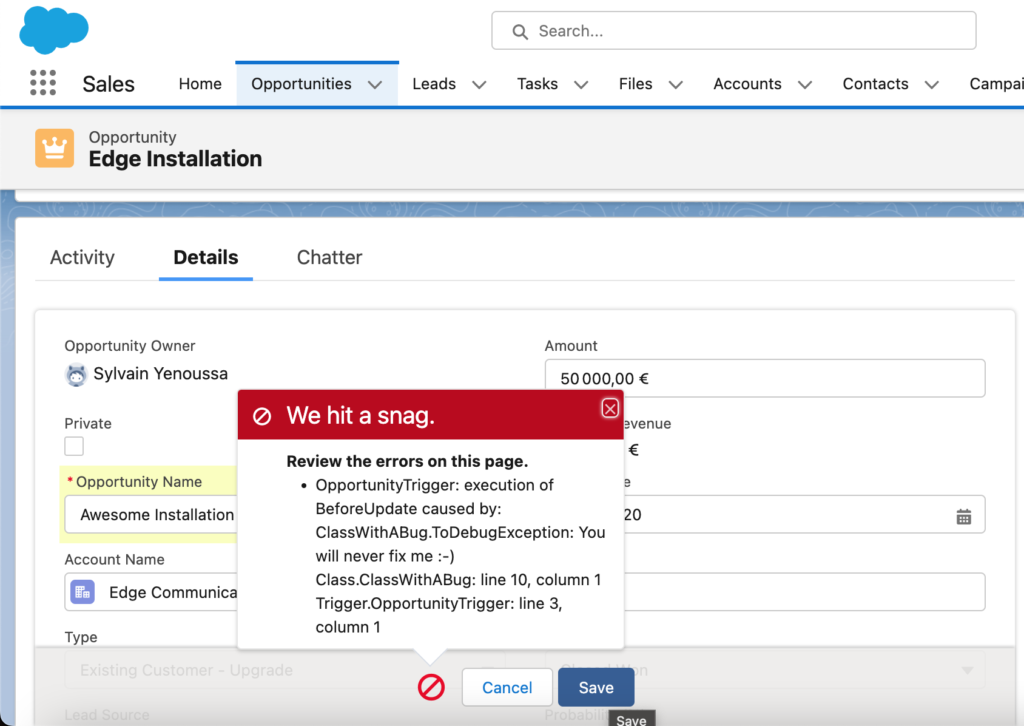
For me the only thing I have to do is to save an Opportunity record whose Name starts by “A” and and Amount > 500.
As expected, I get the error so it means that the code I want to debug have been executed. Now, it’s time to go for retrieving the corresponding log and replay it in VS Code !
Retrieve the Apex debug log locally
Now that I have the confirmation that the code have been executed correctly, let’s retrieve it locally.
It’s quite simple :
- Press CTRL + SHIFT + P and type : SFDX:Get Apex Debug Logs
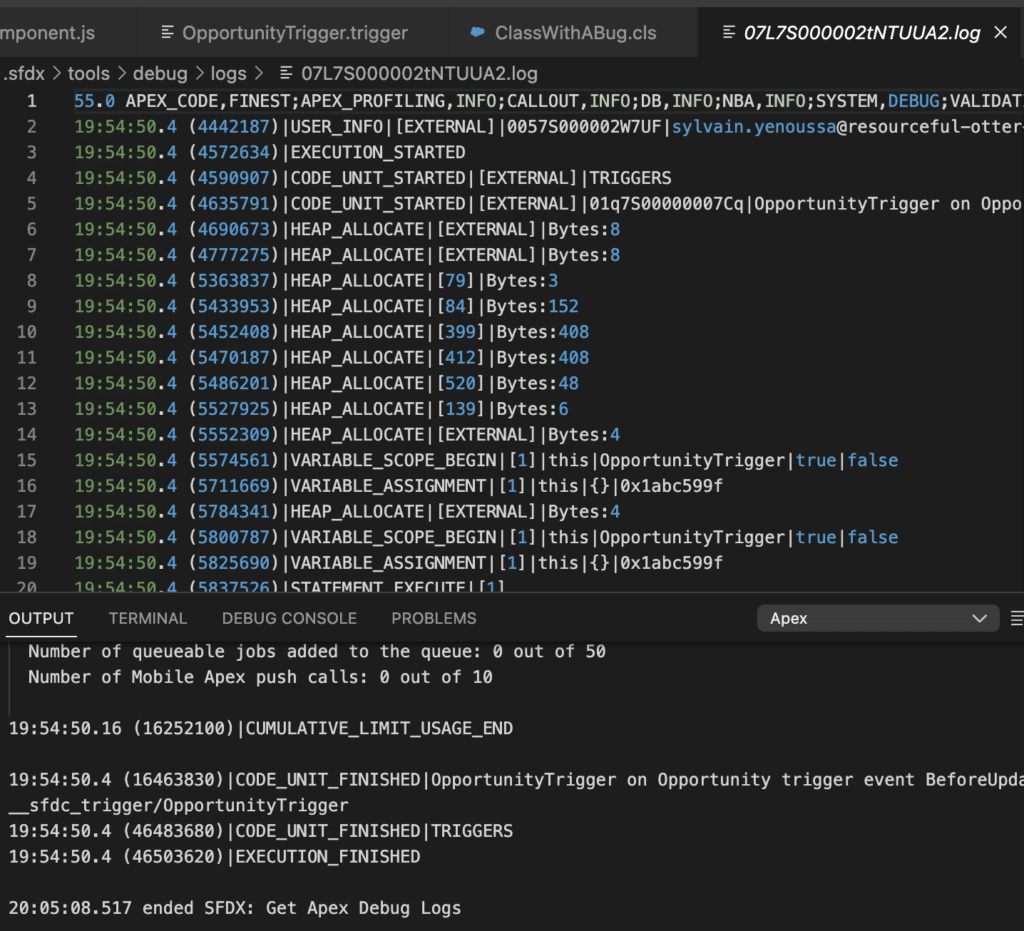
- In the next prompt, choose the debug log that have been created. This can be tricky if you have a lot of developers working there
After a short time, you get locally in VS Code the debug logs. This debug log contains all the information to replay what happened on the Sandbox locally in VS Code.
Launch the replay of the Apex code
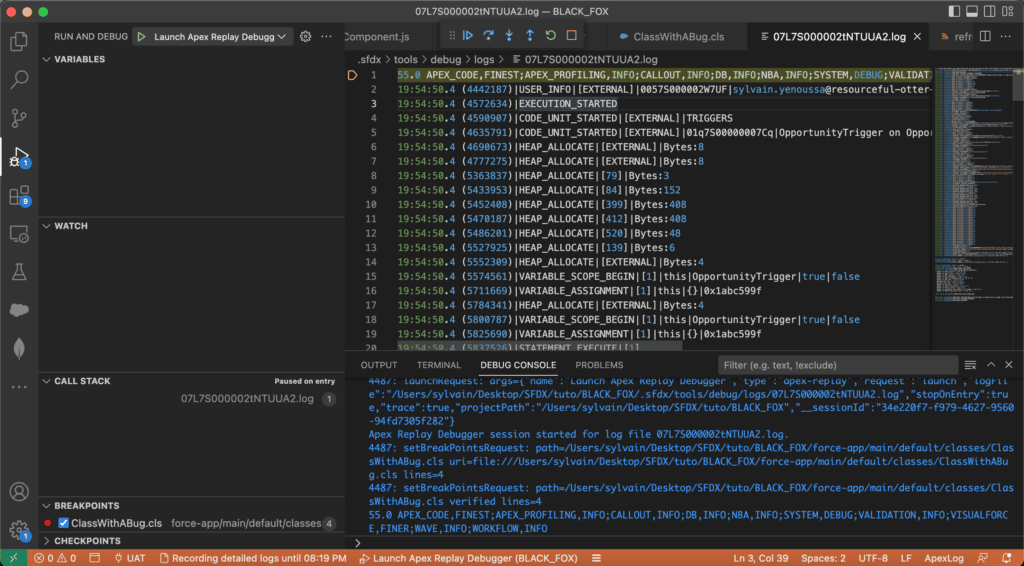
It’s time! In the Apex Debug log you just retrieved, right click anywhere in the log file and select SFDX: Launch Apex Replay Debugger with Current File.
You’ll see your VS Code turn into the debug mode:
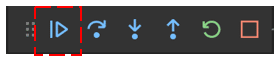
Click on the Continue button on the toolbar that appeared above.
It will start the debug directly where you have put the breakpoint/checkpoint in your code!
Now that you have started to debug, use the toolbar (or the associated shortcut) to move in the replay.
- Step over: goes to the next line of code
- Step Into: goes to the next line of code. But id the current line is calling an Apex method, it will go INTO the method
- Step out: if you entered a method with the above “step Into”, it will allow you to resume the method call and go back to the step AFTER you entered into the method
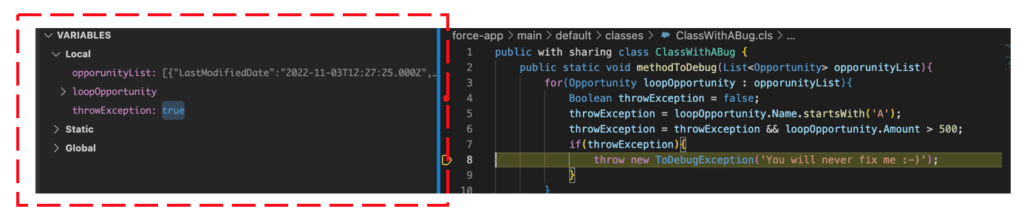
As you can see in the left panel, while you move forward in the execution of you Salesforce Apex code, the variable values are available and you can see the associated values as you progress. This is awesome to understand the behavior of your code !
Sum-up
Let’s sum up what we have seen in a few step to perform to get this done.
- Select a breakpoint in VS Code
- CTRL + SHIFT + P : SFDX:Update Checkpoints in Org to set the breakpoint in the Salesforce ORG
- CTRL + SHIFT + P : SFDX: Turn On Apex Debug Log for Replay Debugger to turn on debug for 30 min
- Do what you have to do to EXECUTE THE APEX CODE
- CTRL + SHIFT + P : SFDX:Get Apex Debug Logs : retrieve the GOOD debug file
- Riht click on the File: select : SFDX: Launch Apex Replay Debugger with Current File in the list
- Click on Continue
That’s crazy simple.
Don’t forget to remove the breakpoint (if I remember well, a Salesforce org can handle only a limited count of breakpoints)
Some limitations are to be known. Since it’s only replay, you can’t change the value of variables, and some other limitations available at this link are listed like you can’t debug scheduled Apex 🙁